Python Programming
Python is an interpreted language with an easy to learn syntax and has very good libraries for graphics, networking, scientific computation etc. It is freely downloadable and available on almost all operating systems. The Phoenix project uses Python for developing all the code except the one running on the micro-controller. There are so many books available on Internet for learning Python. The book Python for Education tries to introduce Python as a tool for learning Science & Mathematics. To run and modify the examples given in this book, a code browser program also is available as a Debian package.
Download the Book in PDF format and the code example browser. A screen-shot of this program is here. (Python book and Code Browser)
Python for learning Science and Maths
In the high school classes, we learn about the various branches of mathematics, like geometry, algebra, trigonometry, calculus etc. , without bothering much about their interconnections. Plotting the graphs of different algebraic and trigonometric functions helps understanding them better. Simple numerical methods can demonstrate the connection between algebra and calculus. This knowledge is useful for for exploring the problems in physics in a different manner.
The software requirement is Python Interpreter along with Numpy, Scipy and Matplotlib packages.
Several videos made during writing these examples also have been uploaded to the Youtube. (Keeping the RecordmyDesktop program running and mumbling while writing code can generate the drag and audio comparable to that of a 19th century steam locomotive)
Short Python Programs, based on Higher Secondary Mathematics and Physics topics
All the examples below have less than 20 lines of Python code, excluding empty lines and comments. If any example exceeds 20 lines, you will find a shorter version also given.
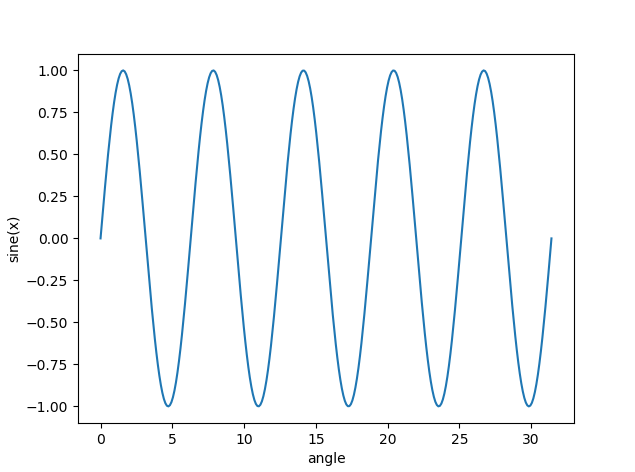
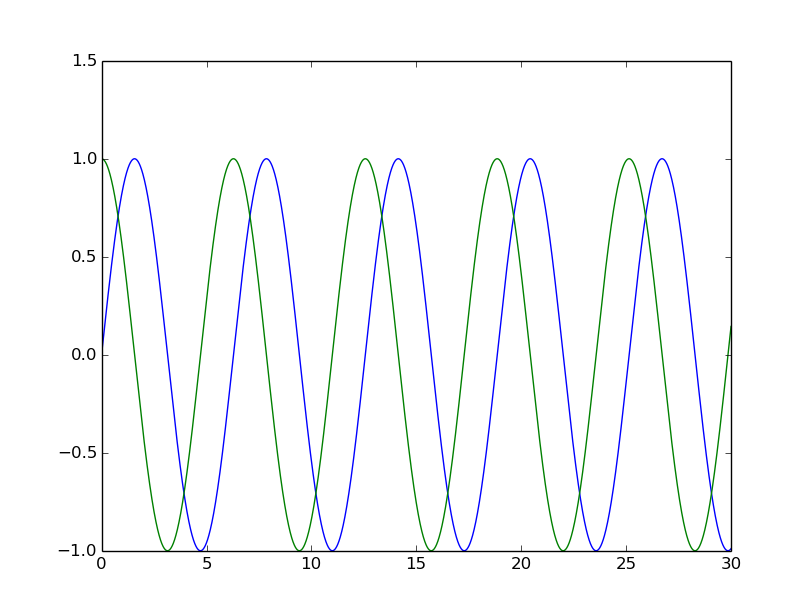
- plot-equation.py : Plotting Graphs using numpy and matplotlib. The example demonstrates sine(x), you may also try other functions. screenshot
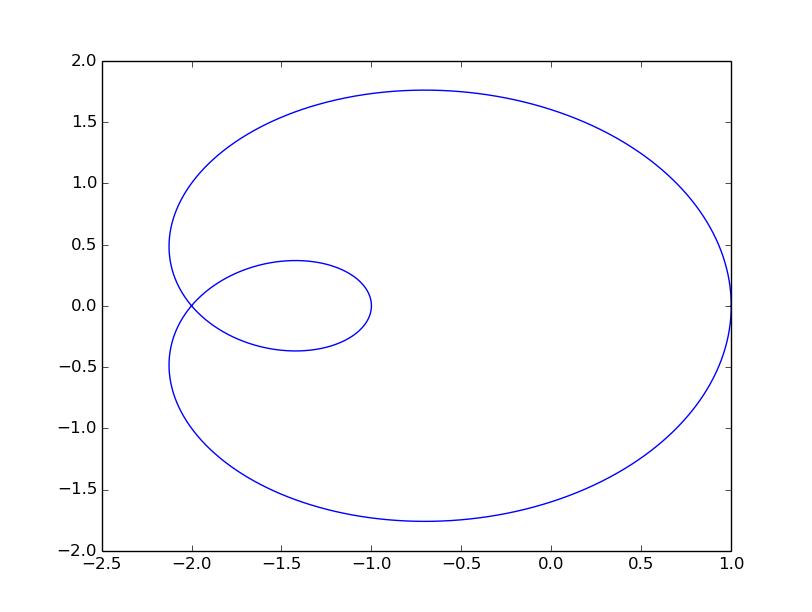
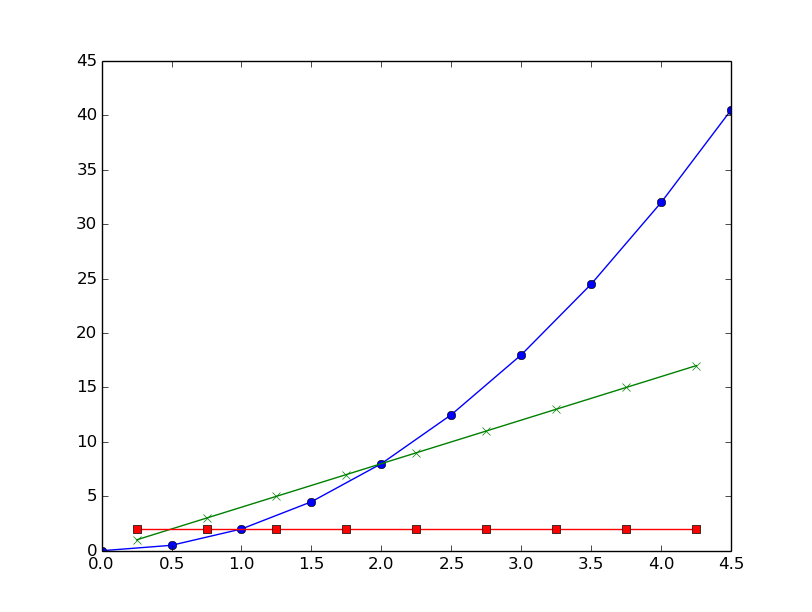
- plot-ncurve.py : Plot some interesting graphs . screenshot
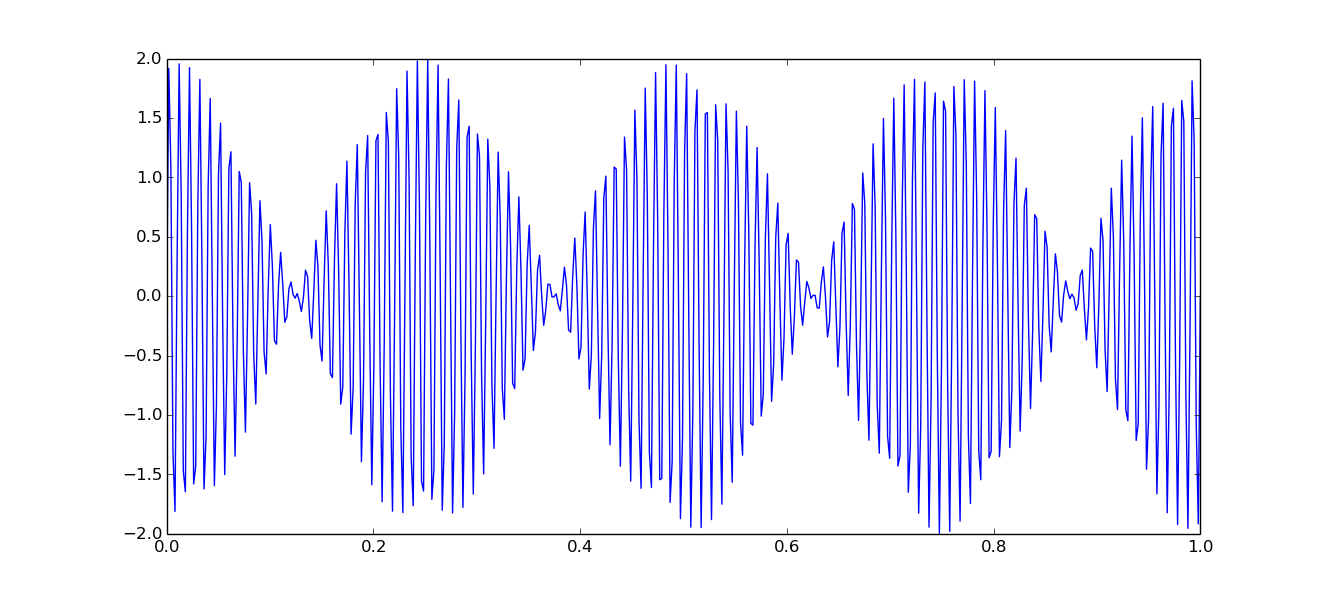
- sum-of-sines.py : Sum of two sine waves result in beats. screenshot.
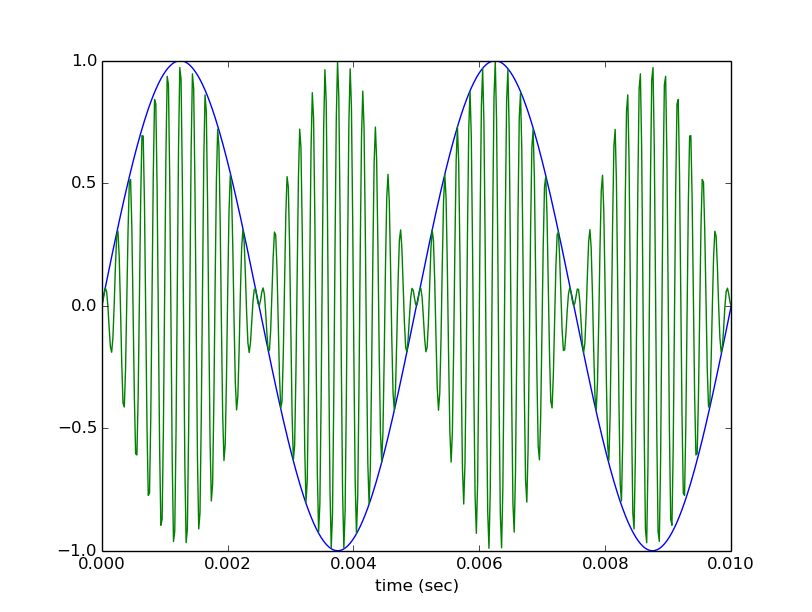
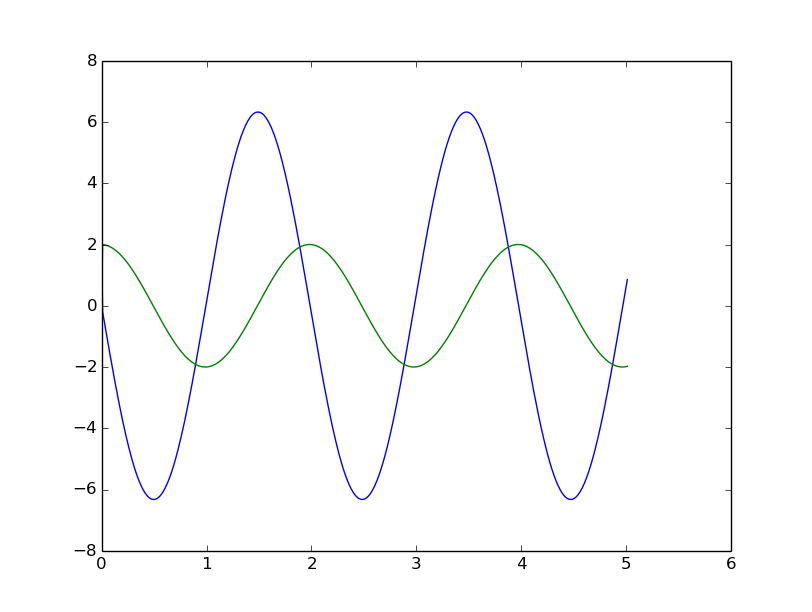
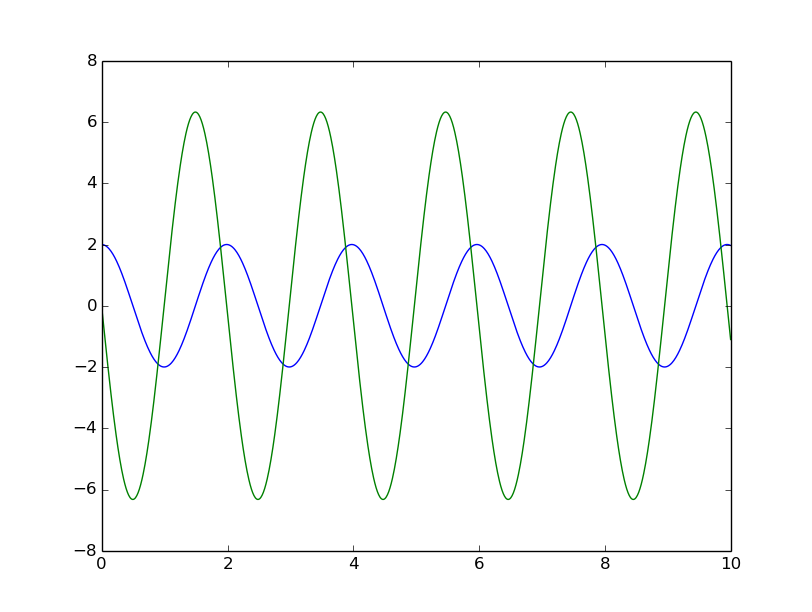
- product-of-sines.py : Amplitude modulation by multiplying two sine waves. screenshot
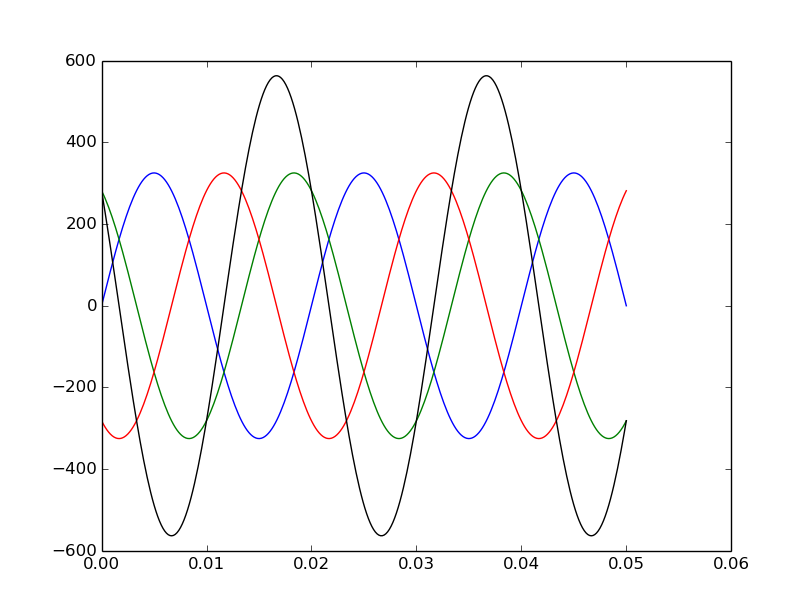
- 3phase-ac.py : Plots the 3 phases of 230 Vrms AC mains, and the voltage difference between two phases. screenshot
- mass-spring-euler.py : Solve the mass on a spring system using Euler method of integration. screenshot
- mass-spring-visual.py : Mass Spring system animation using python-visual, computation using Euler method of integration
- accn-vel-from-pos.py : Calculate acceleration and velocity from position data. screenshot
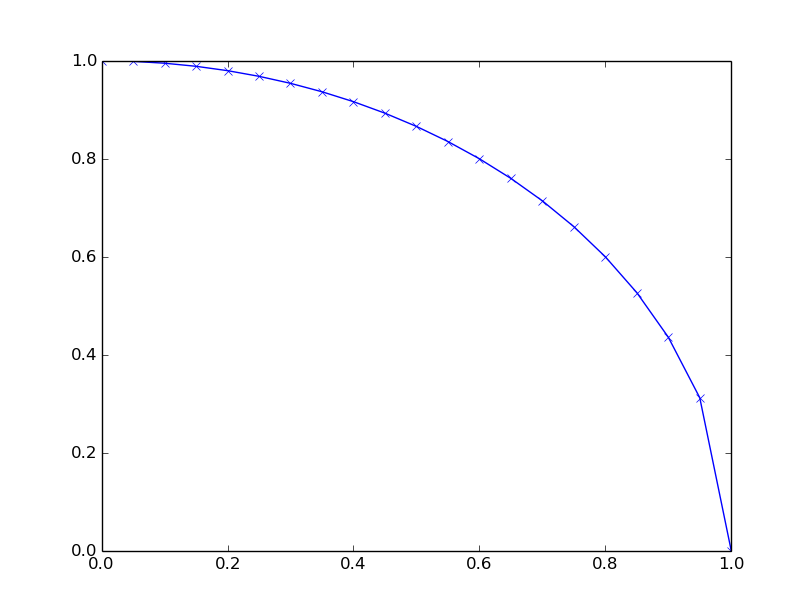
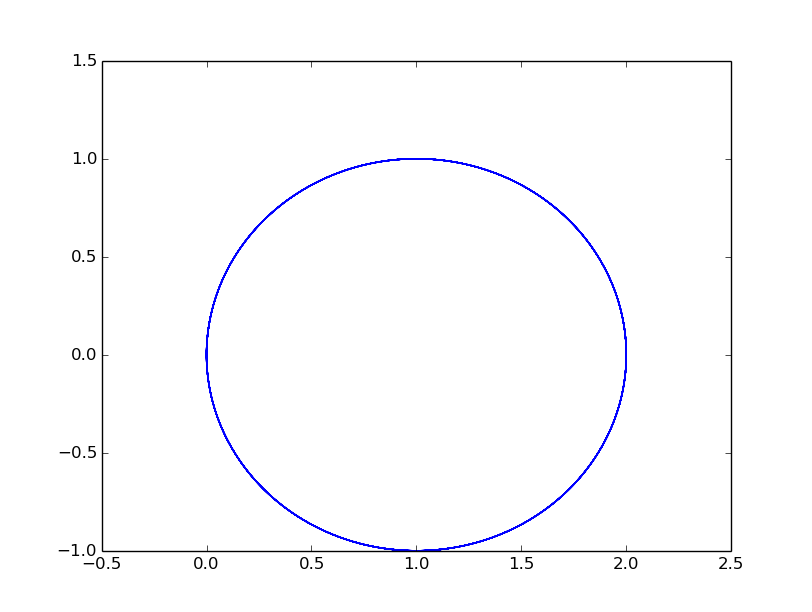
- integrate-trapez.py : Calculate the area under an arc of unit radius from x=0 to 1, using trapezoid rule . Compare the result with pi/4. screenshot
- integrate-scipy-quad.py : Calculate the area under an arc of unit radius from x=0 to 1, using scipy.integrate.quad() function
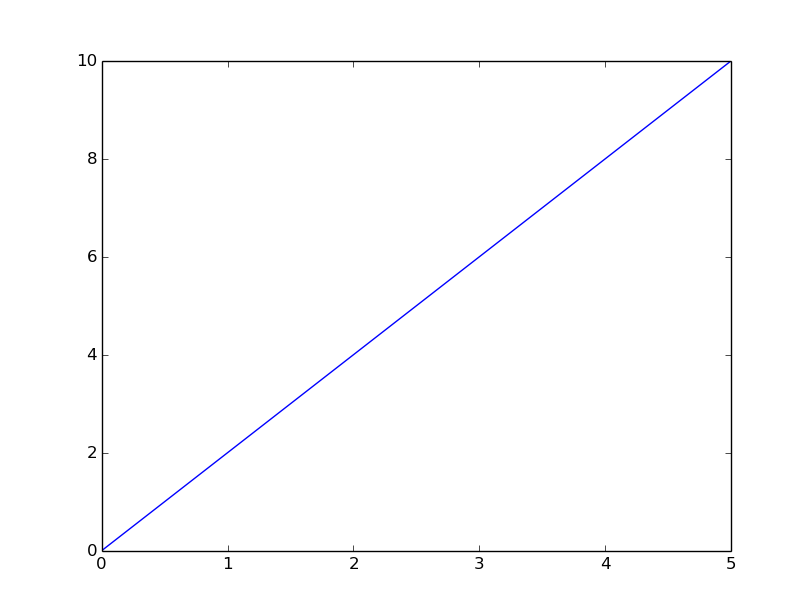
- pos-time-plot-euler.py : One dimensional motion. Velocity and initial position given. Use Euler integration to plot x(t) . screenshot
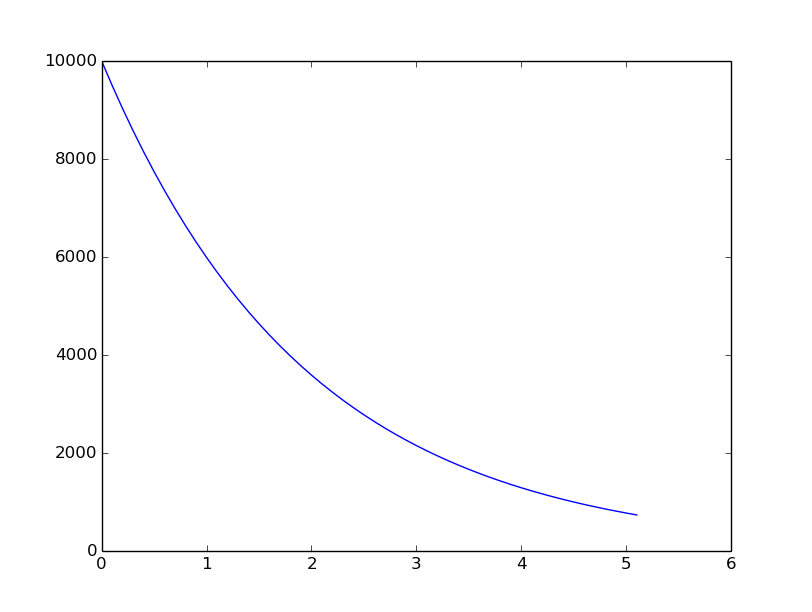
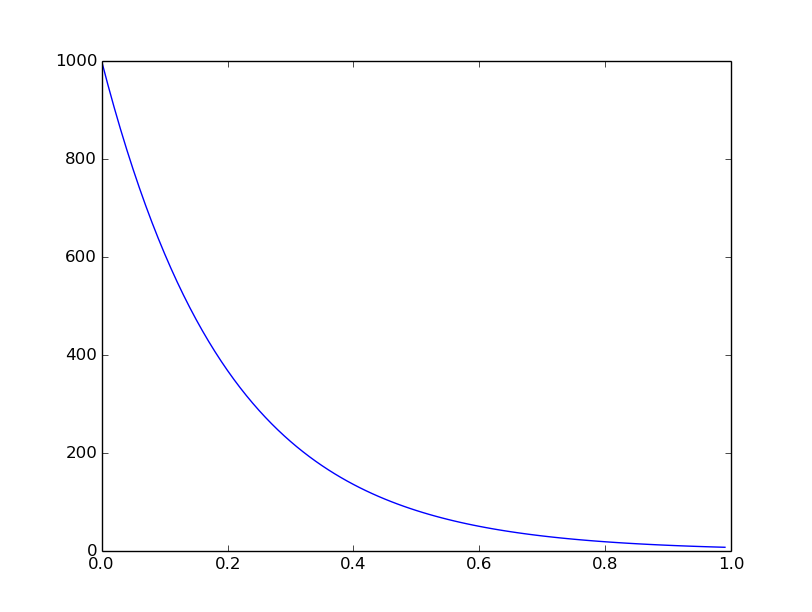
- rdecay-euler.py : Plot the radioactive decay curve calculated using Euler method of solving differential equation dN/dt = -L * N. screenshot
- rdecay-scipy.py : Radioactive decay curve. dN/dt = -L * N, solved using scipy.integrate.odeint() . screenshot
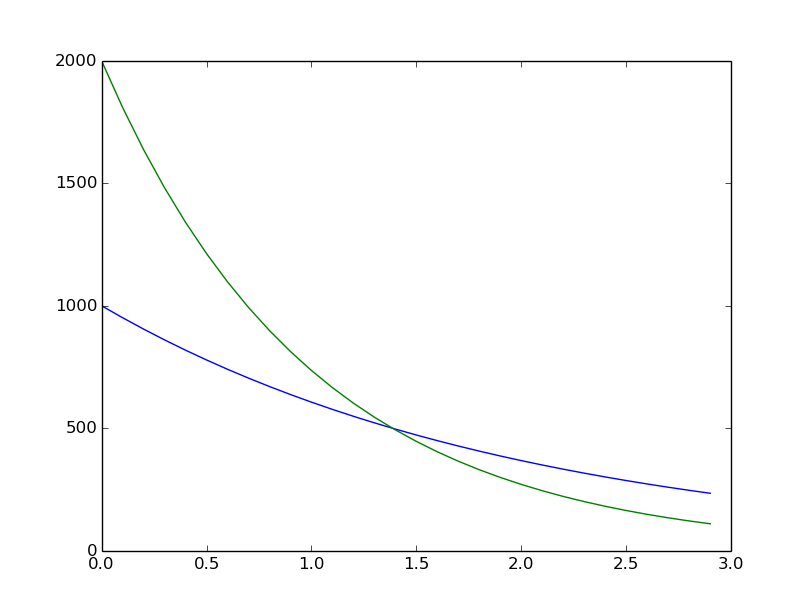
- rdecay2-scipy.py : Radioactive decay curve. dN/dt = L * N. Two of them solved at a time using scipy.integrate.odeint() . screenshot
- second-order-de-scipy.py : Solving second order equation by splitting into two first order ones. solve d2y/dx2 = -y gives y=sin(x). screenshot
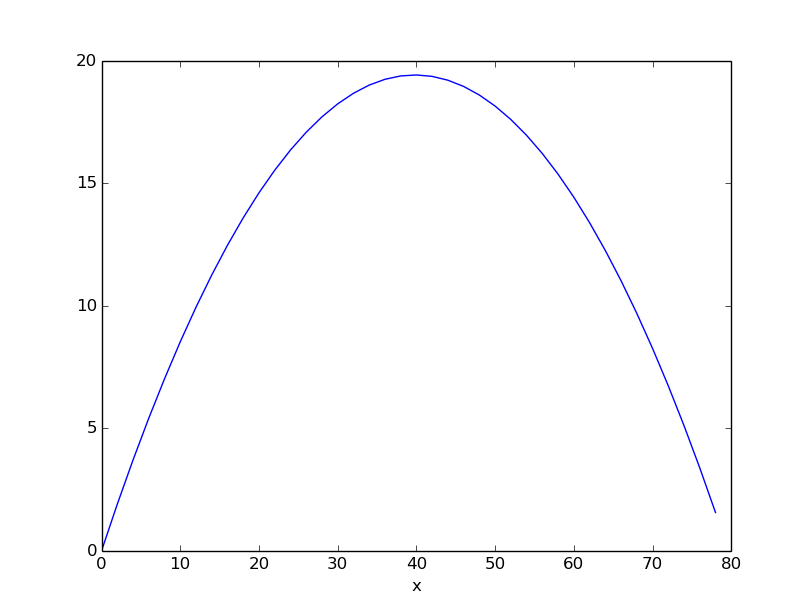
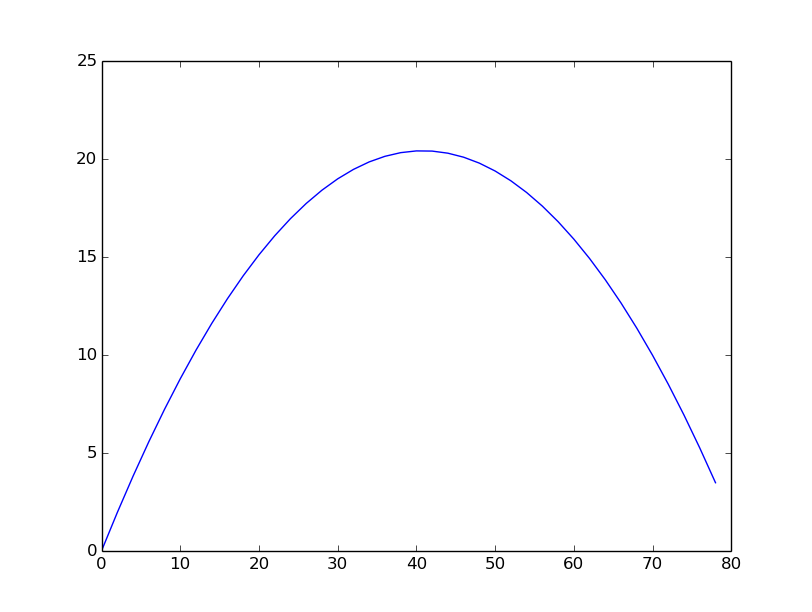
- projectile-2d-euler.py : Projectile motion, trajectory in x-y plane calculated using Euler's method. screenshot
- projectile-2d-scipy.py : Projectile motion, trajectory in x-y plane calculated using scipy.integrate.odeint(). screenshot
- mass-spring-scipy.py : Solve the mass on a spring system using scipy.integrate.odeint(). screenshot
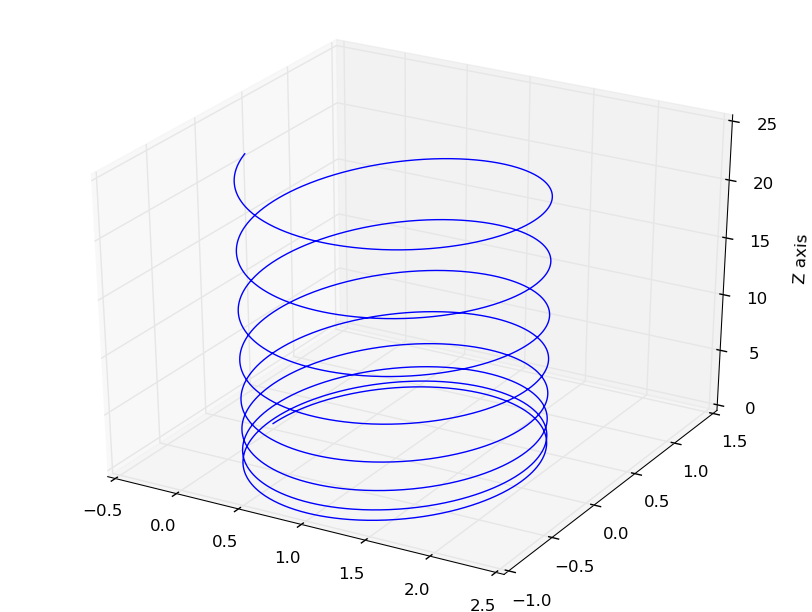
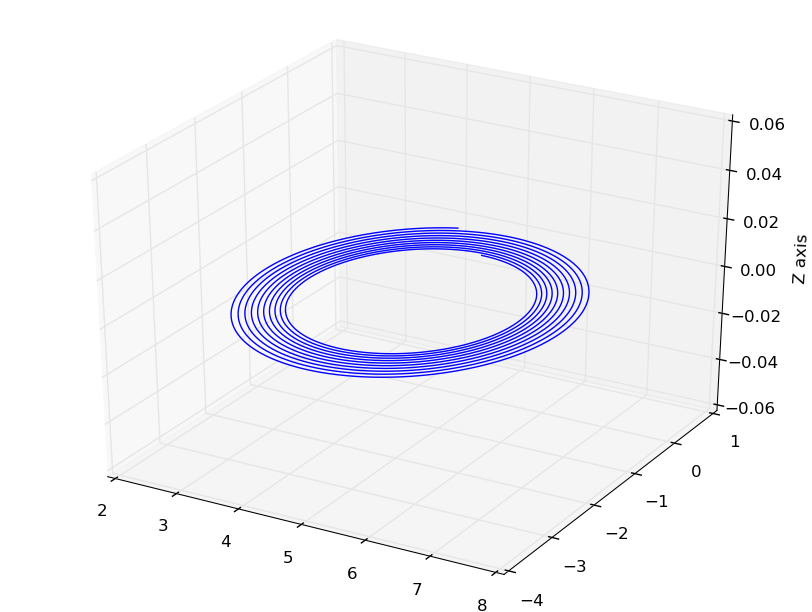
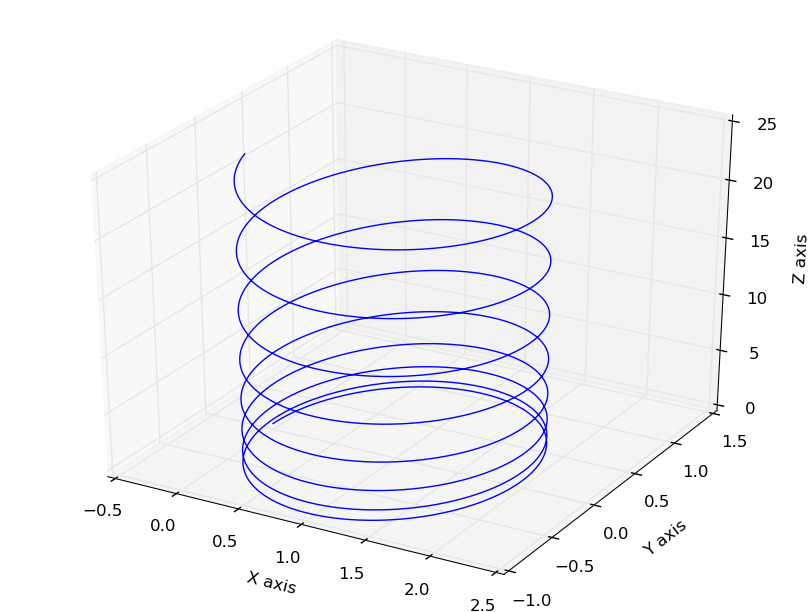
- Lorentz-force-scipy.py : Trajectory of a charged particle in electric and magnetic fields. screenshot
- Lorentz-force-scipy-vector.py : Trajectory of a charged particle in electric and magnetic fields, using vector equations. screenshot
- Lorentz-force-euler.py : Trajectory of a charged particle in electric and magnetic fields. screenshot , circle is becoming spiral due to computational error.
- plot-data-3d.py : Reads multi-column text data from files and plots the first 3 columns, screenshot shows the data from file.
- plot-data-2d.py : Reads multi-column text data from files and plots the first 2 columns, screenshot shows the data from file.
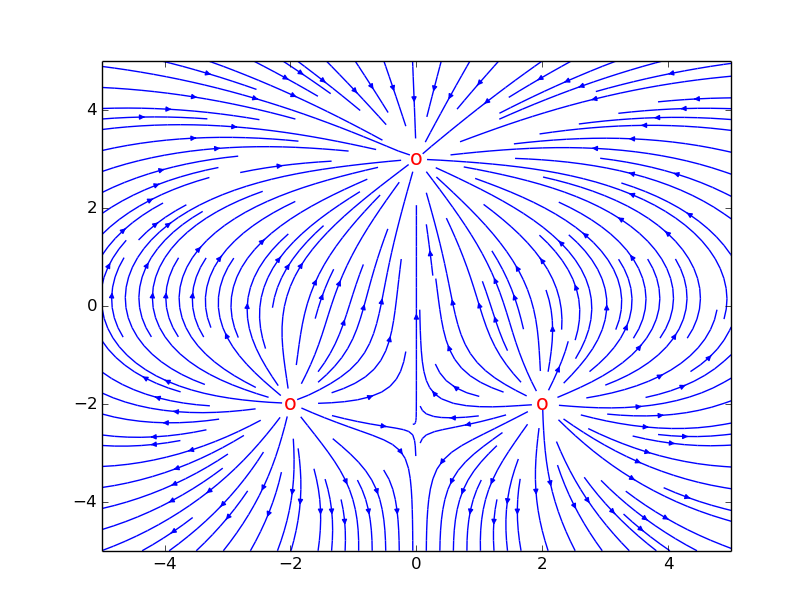
- Efield-plot.py : Plots the electric field produced by several point charges located in a plane. screenshot